 Вход
Вход Зарегистрироваться


In 1900 John Gray and James Tocher reported on pigmentation statistics for East Aberdeenshire. This project was part of the writers’ wider anthropological concerns. Gray was Scottish, born in Strichen, Aberdeenshire in 1854 and his early work was concerned with mechanical subjects. In 1878, for example, he obtained Associateship of the School of Metallurgy, of the Royal School of Mines and in 1879 he was awarded a degree in engineering from Edinburgh. In later years, anthropology became his chief pursuit, but he never lost interest in electrical matters and secured election as a Fellow of the Physical Society (1879–1905) and an Associate of the Institution of Electrical Engineers (1887–1902). His first contribution to anthropology appeared in 1893, in the Transactions of the Buchan Field Club, in a piece entitled ‘Historical notes on Strichen’. In 1899 he became the President of this society, whilst James Tocher was secretary of the club. Gray was also much involved in designing new instruments for anthropological work and at the time of his death he was working on a machine, which registered the
speed at which an observer ceased to see flicker in a revolving disc coloured in black and white segments. He called this the “intelligence machine”, and was working on it until the time of his death. He died of pneumonia in 1912, aged 59.[55]
James Fowler Tocher (1864–1945) was born in Fyvie, Scotland, in 1864. He qualified as a Chemist and Druggist in 1886 and began his adult life by opening a chemist’s business in Aberdeenshire. It was very successful but he closed down in 1912, in order to move into the arena of professional chemistry.[56] By this time he was well known in the field of biometrics, and became a good friend of Karl Pearson.[57] He lectured part time in statistics at the University of Aberdeen from 1911 until 1941. Tocher was involved in much anthropological research in the Aberdeenshire area and he owed much to the Buchan Field club, of which he was a founder member and through which he published his early statistical papers. 1910 saw the publication of the Book of Buchan, which he edited. Buchan was the old name for an area in East Aberdeenshire—this book was divided into six sections dealing with the geological and floral and faunal
history, the first peopling of the area, the first written history, the colonization of the area, the history of burghal life in the area, and aspects of modern Buchan. Tocher undertook other anthropometric investigations, chiefly on the insane population of Aberdeenshire and surrounding areas. He was sponsored in these investigations by the William Ramsay Henry Trust, publishing a report on the characteristics of inmates in lunatic asylums, in 1905, and a second (on comparisons between the sane and insane populations for north-east Scotland) and third (on Comparisons between Scottish soldiers and the insane population of Scotland) in 1924.
Each of these compared several physical characteristics, namely head length, breadth and width, stature and hair and eye colour.[58] The third report also contained eight anthropometric maps for the military sample, for the various head measurements and for stature and each report used new
statistical methods to compare different characteristics. In 1902 Gray and Tocher had carried out anthropometric work in Aberdeenshire based on correlating pigmentation statistics with surnames among school children, in order to determine connections between surnames and blondness. This marked the beginning of their combined work on racial types in Scotland. Each of them were also involved in committees for anthropometric investigation, within Section H of the BAAS.
Tocher was also a eugenist, an understandable alliance given his continued interest
in asylum populations. In 1910, he remarked that:. . . our concern as eugenists, our object as reformers, is to work towards a state of Society where the action of individual units, as a whole, shall produce stability in the community, and where the individual units are fitter and happier, on an average, than they are today—so fit, indeed, that disease shall be rare and so happy that unmerited suffering shall be quite unknown.
Tocher’s objectification of human individuals is apparent here and is typical of the period. With reference to eugenics, Tocher also remarked that high proportions of men of great ability sprang from certain areas of Scotland, because only the physically and mentally powerful could have survived the unique ordeal of Scotland’s chequered history. Tocher acknowledged the increased proportion of those with dark hair living in towns, and considered that the pattern in Glasgow was due to increased migration from areas where dark types were prevalent. At no point did he make moral assumptions about the superiority or inferiority of dark or light types. He regarded Scotland as having many areas of good stock, and remarked: “throughout the whole country good stock exists among the industrial and middle classes. It is, I believe, despite the drain of emigration, specially prevalent in the rural population of Scotland.”[60]
A parallel can be drawn between these ideas and Fleure’s Welsh surveys. Both writers lament
demographic depletion and out migration from periphery to core. In the same way in which Fleure imposed a moral topography on the peoples of Wales, Gray and Tocher’s racial mapping imposed a moral topography on the Scottish landscape, which is revealed by their 1900 paper.
Gray and Tocher’s contribution within the Journal of the Anthropological Institute arose from two major surveys they had undertaken in association with the Buchan Field Club.[61] Measurements were procured at the Mintlaw Gathering (where locals assembled for dancing and sport) in 1895.[62] The survey involved recording, at the gate, the hair and eye colour of 2309 males and 551 females and, in a tent constructed explicitly for this purpose measurements were carried out of 169 males. The whole
procedure was indicative of a statistical enthusiasm among human biologists throughout this period. A second survey involved carrying out a pigmentation analysis of the schools in the East Aberdeenshire area, and resulted in pigmentation statistics for 14 561 children (7717 boys and 6844 girls), coming from 93 different schools in the area.
Gray and Tocher divided the results of these surveys according to pigmentation of hair and eyes. Their divisions were based on John Beddoe’s method, which involved the use of three categories for eyes, light, neutral and dark, and four divisions for hair; fair, red, brown and dark. Beddoe later added niger (or jet black) to these categories. Results were displayed on a series of 12 different maps, constructed using, what they termed, contour lines of pigmentation, and each representing a different colour type.
Figure 1 displays results for the brunette type in East Aberdeenshire. These racial cartographies were constructed by plotting the percentages of the type of pigmentation (e.g. fair hair, brown hair) for each school. The numbers were then treated as if they were heights on a relief map, and the intervals were calculated by using standard deviation, a statistical measurement which had by this time been constructed by Karl Pearson.[63]
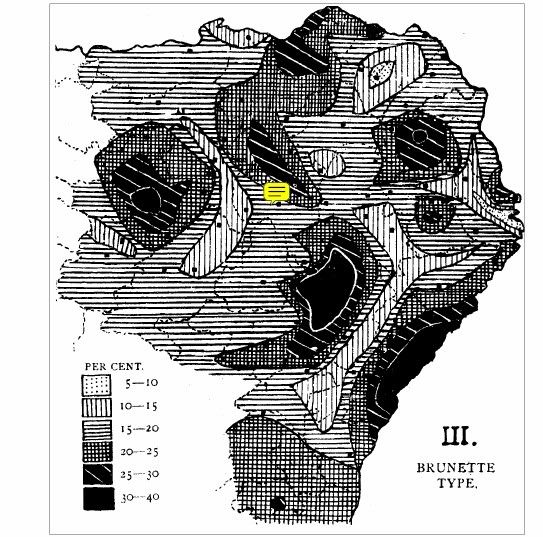
Figure 1. Results for the Brunette Type in East Aberdeenshire. Source: J. Gray and J. F. Tocher,
Physical Characteristics of Adults and School Children in East Aberdeenshire, Journal of The
Royal Anthropological Institute 30 (1900) 104–124.
The shading of areas without reference to differing population densities, and the construction of contour lines representing a concrete division between different types of course served to impose visual clarity on the data. Several areas of the map display highly regular boundary lines reflecting the use of mathematical formula employed rather than any ‘natural’ divisions between racial types. Altogether the
method of shading is effective in that clearly delineated areas are marked, and the impression of some sort of clear order and distribution is given.
Similar observations apply to John Gray’s 1907 paper “Memoir on the Pigmentation Survey of Scotland,”[64] which used similar data for Scotland as a whole, this time for, approximately 500 000 school children, based on hair and eye colour.[65] This memoir contains a total of 21 maps. By glancing at these representations several racial divisions are immediately obvious, and again these images reinforce the claims of Gray’s writing. The pervading political climate of the time, including the influences of imperialism and an increased awareness of overseas ‘others’, and the attitudes to race within science in this period (i.e. the idea that there was a finite number of races which could be fitted into a hierarchy based on physical characteristics and ideas of racial decline within (Britain) are examples of an external power reinforcing and legitimizing Gray’s claims.[66]
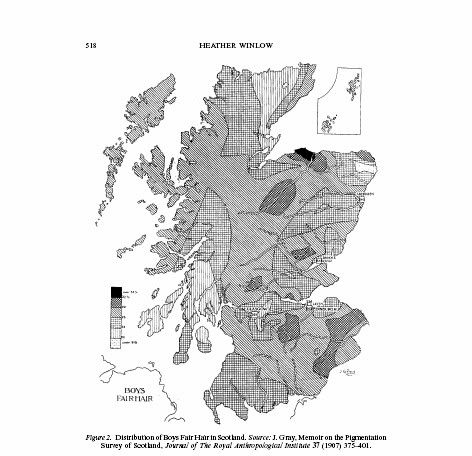
Gray’s article itself is also a power external to the map, and the maps and text mutually reinforce one another. These maps however also do contain their own power, in the use of shading and categorization, and the divisions on the map. Gray was himself aware of their visual impact: “The intervals between the contour lines”, he observed, “have been shaded according to a scheme, which makes readily obvious to the eye the various densities of pigmentation between the contour lines.”[67] This map is striking,
in that the variations between the different densities of pigmentation are readily obvious,
and areas with a very high or low percentage are immediately noticeable. For example, Figure 2 reveals a conspicuous dark area representing a concentration of blond types, as well as a very small area with a low percentage in the north-east of the country. As with the maps in Gray and Tocher’s 1901 paper, a geometrically imposed classification is obvious. Here too Gray introduced his concept of what he called “divergence maps of pigmentation” (Figures 3 and 4). These covered the colour distribution for boys’
hair and eyes for the whole of Scotland, and were constructed using logarithms based on pigmentation frequencies on an area basis. The final values defined the contour intervals as before. The maps were intended to reveal how the population was distributed within the country, indicating which areas were made up for native Scots, represented by darker types, and which by Norse invaders, who had a lighter pigmentation. Before these maps were produced, however, further statistical manipulation was needed and these contributed to a greater number of inconsistencies. Again the whole area has
been shaded, although samples would have been more concentrated around cities, and again geometric divisions can be observed on these maps.
The purpose of many of these investigations was due to debates surrounding the presumed deterioration of the ‘national character’. Gray and Tocher shared these national concerns, as is indicated by Tocher’s involvement in eugenics. However, as this paper illustrates, there was some difference of opinion as to which racial types were representative of degenerate stock. Tocher’s reference to the loss of good rural types to other British cities, indicates a preference towards the continuance of the traditions of the dark ‘Celtic’ types and a concern with Scottish identity. Whatever the concerns of specific scientists, it is pointless to divide the population on the basis of hair colour or eye colour, or any other method of measurement, because these divisions are artificial constructs. Other formulae could be used to produce widely varying results, depending on the values given to different characteristics. As Gould
writes: “The human body can be measured in a thousand ways. Any investigator, convinced beforehand of a group’s inferiority, can select a small set of measures to illustrate its greater affinity with apes.”[68] Anthropometry (or the measurement of the physical traits of humankind) reflected a search for characters that would display the ‘correct’ ranking, generally stressing the dominance of the white European. Although Gould wrote with specific reference to craniometry these same comments can be applied to measurement of skin colour. Gray and Tocher assumed the existence of a scale of darkness, and degrees of pigmentation, within the ‘white’ population of Scotland.
Anthropometry, of any form, was definitely not a numeric exercise in raw empiricism. The mapping of race was based on wider nineteenth-century European assumptions where it was legitimate to categorize humans through varying forms of measurement, and therefore it was seen as legitimate to represent these measurements spatially.
John Beddoe and the Index of Nigrescence
The following year, 1908, John Beddoe responded to Gray’s paper.[69] By the time this article appeared Beddoe was already well-known in the field for analysing pigmentation statistics, mainly for Great Britain and Ireland. Beddoe was born in Bewdley, Worcestershire, in 1826. After studying the natural sciences, he became a medical doctor in Bristol in 1857, where his interest in physical anthropology developed. He made notes on the physical characteristics of his patients,[70] and also collected data from 200 other correspondents, mainly doctors, producing in 1868 a manuscript on the Origin of the English Nation, which later became The Races of Britain, published in 1885 and gaining him national acclaim.[71]
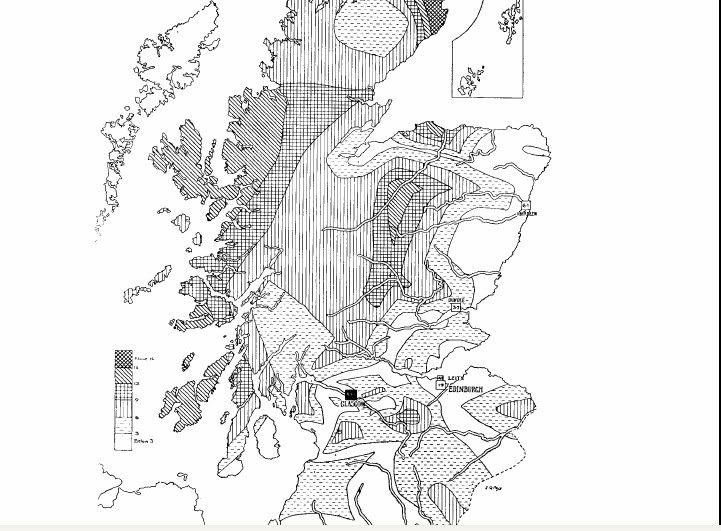
Figure 3. Divergence Map for Boys Hair Colour, Scotland. Source: J. Gray, Memoir on the
Pigmentation Survey of Scotland, Journal of The Royal Anthropological Institute 37 (1907)
375–401.
In 1869 he was made President of the Anthropological Society of London (after the death of James Hunt) and in 1870 he was elected to the council of the British Association for the Advancement of Science (BAAS). Due to the success of his first book he became President of the Anthropological Institute from 1889–91 and this led to his invitation to deliver the Rhind Lectures of 1891 at Edinburgh University, which later became The Anthropological History of Europe.[72] A convinced evolutionist, he also had the honour of giving the Huxley Memorial Lecture, entitled ‘Colour and Race’ for the year 1905.[73]
In The Races of Britain Beddoe first introduced his main method of analysis of pigmentation data, his ‘Index of Nigrescence.’[74] To Beddoe, hair colour was far more important than eye colour. Stepan describes his method as “a curious mathematical formula” and a “quasi-algebraic equation ostensibly measuring precisely the darkness of the skin.”[75] In the present context, however, it is the translation of his formula’s deliverance’s into cartographic form—an aspect that Stepan ignores—which attracts
our attention. The procedure involved adding twice the percentage of niger to the percentage of dark hair, and then subtracting the values of fair hair and red hair. This was expressed as (2N+D−F−R), where N=Niger (jet black), D=Dark Brown, F= Fair and R=Red. The simple fact that Beddoe considered constructing an index of darkness at all seems to have strongly racist overtones. Even the use of the word nigrescence has racialist resonance with fears of civilization reverting to savagery, through increasing darkness of skin. The nigrescence index incorporates ideas of a progessionist ladder with blacks on a lower rung than whites. However, Beddoe was not the only one to adopt this approach. The Racial Committee of the BAAS, for instance, attempted to define racial categories, by calculation of ‘degree of nigrescence’ for different sectors of the population. “Criminals, for example, were shown to have an excess of dark eyes combined with dark hair . . . over the general population.”[76]
Despite the seeming clarity of Beddoe’s mathematical impulses, his work displays tensions at crucial points. He was an environmental determinist believing that factors such as sunlight and temperature affected the skin, eye and hair, colour of individuals as well as other physical features. At the same time he was persuaded of the relative permanency of these characteristics and that pigmentation was the most reliable way of measuring race. This is illustrated clearly in his 1905 article, where he observed that
across Europe there was a definite relationship between skin colour and isothermals. He wrote: “it is impossible to ignore the gradation of colour, the gradually increasing depth of tint from north to south” which indicates the definite effects of environmental factors. Yet Beddoe still insisted on using colour to define ‘race’. Stepan asserts that because he was an evolutionist, which was where his lifelong interest in race had begun, he was not in a position to regard any characteristic as completely permanent.[77] It seems that he would have had to regard these characteristics as influential only withina certain time span. Other scientists took this time element into account. For example,the Egyptologist Sir William Matthew Flinders Petrie (1853–1942) was of the opinion that the two main physical tests of race which were being used at this time (colour and cephalic index) were only decisive within a period of less than 1000 years because after this time these characteristics would have been changed by “force of environment”.[78] Beddoe made similar observations in the British Isles. He noted a deepening tint from north-east to south-west, which “must surely be due in part to the influence of media,
of sunlight and other like influences, acting probably through natural selection”. Beddoe therefore admitted that colour was affected by the environment, but argued also that colour was a long lasting hereditary trait. These two aspects of his work did not complement one another, but he attempted to incorporate both viewpoints through his own belief in the importance of environment, and the need for semi-permanent race traits in order to classify continuing race ‘types’.
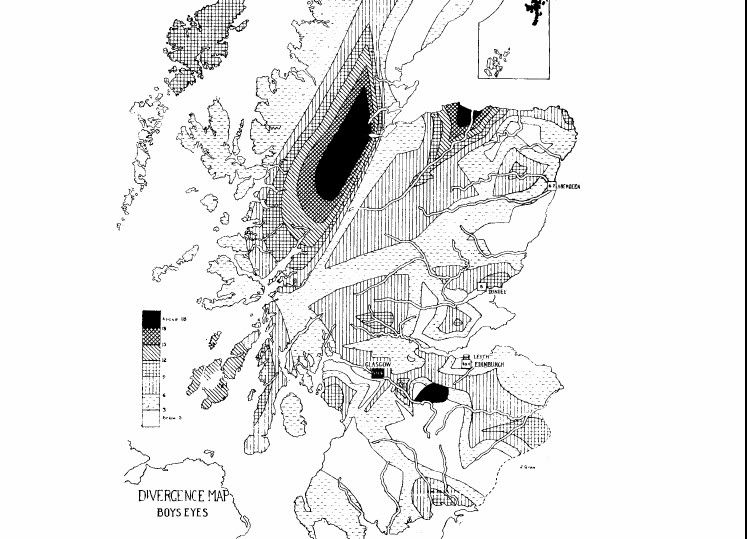
Figure 4. Divergence Map for Boys Eye Colour, Scotland. Source: J. Gray, Memoir on the
Pigmentation Survey of Scotland, Journal of The Royal Anthropological Institute 37 (1907)
375–401.
Beddoe’s distribution of nigrescence for the British Isles is shown in Figure 5. This map appeared in Races of Britain, and displays all the locations where Beddoe recorded measurements. Towns are represented by squares, whilst country locations are represented by circles. The problems inherent in the use of the nigrescence index are reproduced here, as the index for each area was superficially constructed before the data were mapped. Beddoe often emphasized the predominance of dark types in Ireland and Wales, which could also be extended to include the ‘Celtic’ types of Scotland. These ‘types’ were seen to be a degrading element of the population and Beddoe suggested that “[t]he combinations of dark brown or black hair with blue, light grey or dark grey eyes are remarkably prevalent in all Gaelic countries, belonging perhaps to the ancient race of Cro-Magnon, but certainly to a stock long ago thoroughly incorporated with the Gaels.”[79] Beddoe also associated racial types with social issues,
and remarked that “[d]ark hair and eyes are as prevalent in Wales as Radicalism and Non-Conformity.”[80] His attitude towards the Celtic types differs widely from opinions expressed by Tocher, and by Fleure, due to an acceptance of the prevailing assumption that darker types represented a deterioration from the Teutons/Anglo–Saxons, and brought a deteriorating influence to British cities. In contrast, Tocher and Fleure regarded urban migration as an important input of good ‘stock’ into these areas.
In his 1908 paper then, Beddoe takes Gray’s figures for pigmentation in Scotland and produces a composite Scottish map, based on what he calls the “Compound Index of Nigrescence” (Figure 6). This particular index was constructed by adding the index of the eyes to twice the index of the hair for each area. The north-east lowlands are represented here by a high percentage of light hair and Beddoe comments that in this area the native Celtic/Pictish population, represented by dark ‘types’, must have been almost wholly swamped by Norse invaders. The highland areas however are represented by a higher nigrescence index, indicating the ‘Celtic’ make-up of the population.
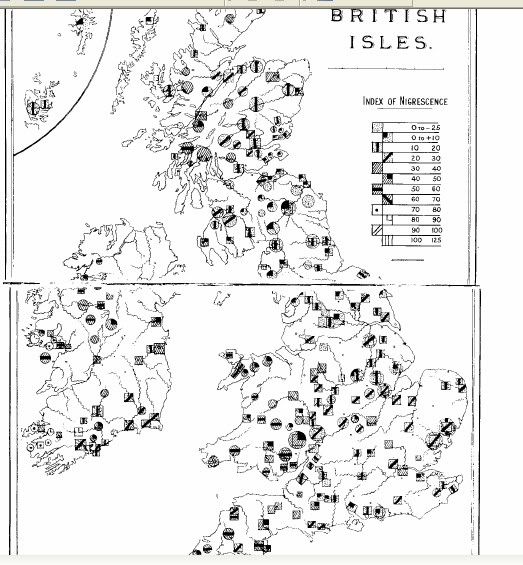
Figure 5. Index of Nigrescence for the British Isles. Source: J. Beddoe, The Races of Britain – A
Contribution to the Anthropology of Western Europe (London 1885 [1971]).
Beddoe’s construction is based on results which Gray showed on 21 separate maps. Several criticisms of this method are valid, including the shading of the whole area on the map, and the construction of artificial race divisions. This final cartographical representation incorporates all the data manipulation used to produce Gray’s maps as well as further adjustments made by Beddoe to construct a new index. The strength of the visual image as a tool of ‘truth’ and ‘accuracy’ is again evident here. This visual image is supported by the external power of the perceived legitimacy of categorizing race types in Victorian anthropology and appears to express an overall coherence of distribution of types in Scotland, which is emphasized by the use of shading. The map conceals the method which has been used to construct and manipulate it. It appears to be ‘scientific’ and ‘neutral’ but “[m]aps are never value-free images . . . [and] are not in themselves either true or false.”[81] Again, as with the previous examples, Beddoe’s racial images are simply constructed representations of race based on a notion of racial hierarchy or racial essence, which could then be demonstrated, through the manipulation of statistics, using any number of racial traits. Beddoe’s anthropological interest developed from a preconceived notion that human beings could be divided into a hierarchy based on a scale of pigmentation.
Conclusion
Cartographic representations of ‘race’ were situated within the context of late nineteenth and early twentieth-century Britain. This paper has illustrated how evolutionary theories, fears of degeneration, the domination of physical anthropology, production of moral statistics, and regional identity interacted in the social construction of a racialized regional taxonomy.
In their search for specific race types anthropologists and geographers objectified the individual through the adoption of statistical methods introduced into biological science by Galton and Pearson. Despite continued fascination with racial categorization, race was never clearly defined in the nineteenth century, as individuals sought after ideal types, which existed only in the mind of scientist.[82] Science cannot be regarded solely as an ‘objective enterprise’ and has to be understood as a ‘social phenomenon’.[83] In this period the development of evolutionary theories and the imperial connections of
Great Britain led to an increasing awareness of race. Internal problems, such as increasing levels of poverty and crime, resulted in the application of racial concepts to the home population. This has been illustrated here through the discussion of degeneration theory and the attempts by Beddoe and Tocher and Gray to define racial divisions within Scotland.
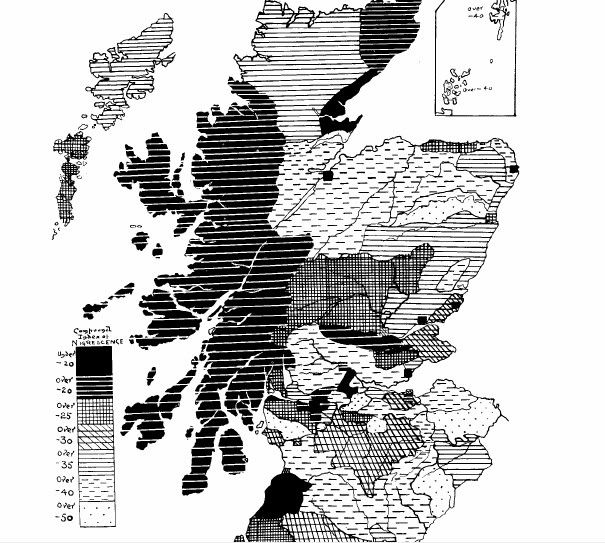
Figure 6. The Compound Index of Nigrescence for Scotland. Source: J. Beddoe, A Last
Contribution to Scottish Ethnology, Journal of The Royal Anthropological Institute 38 (1908)
212–220.
Within the work of these anthropologists anthropometric cartography played a vital role in legitimating the assertions of the written text. The use of anthropometric cartography imposed a clarity on the data and the maps appear to represent a coherent distribution of racial groups and types. The construction of racial maps meant that one could visualize the racial taxonomy discussed in the texts. The general acceptance of the legitimacy of racial hierarchies, and of cartography as a mirror of reality are examples of the external power of these map texts, whilst the manipulation of moral statistics, creation of artificial race divisions and use of shading are examples of power inherent within the map text.
There were varying reasons for the use of anthropometric cartography as a tool to support racial theorizations. This is illustrated by the work of several geographers and anthropologists. In the USA, Huntington and Ripley expressed concerns over the increasing immigration from southern European countries which, as in Britain, involved the assumption that people with darker pigmentation were inferior.[83] Fleure’s reason for mapping racial types within Wales was due in part to concerns of increasing industrialization, and loss of rural tradition and he refused to accept the superiority of the Anglo–Saxon ‘race’. Beddoe accepted the general assumption that the perceived darkness occurring in the cities was a sign of national deterioration, whilst Tocher and Gray did not make these assumptions, and Tocher perceived the loss of workers fromrual areas as a decline in the stock of Scotland.


 Наверх
